Raffaele Gesulfo
Monitor, Logistics Analytics
Narvar │ Product Design │ 2017 - 2018
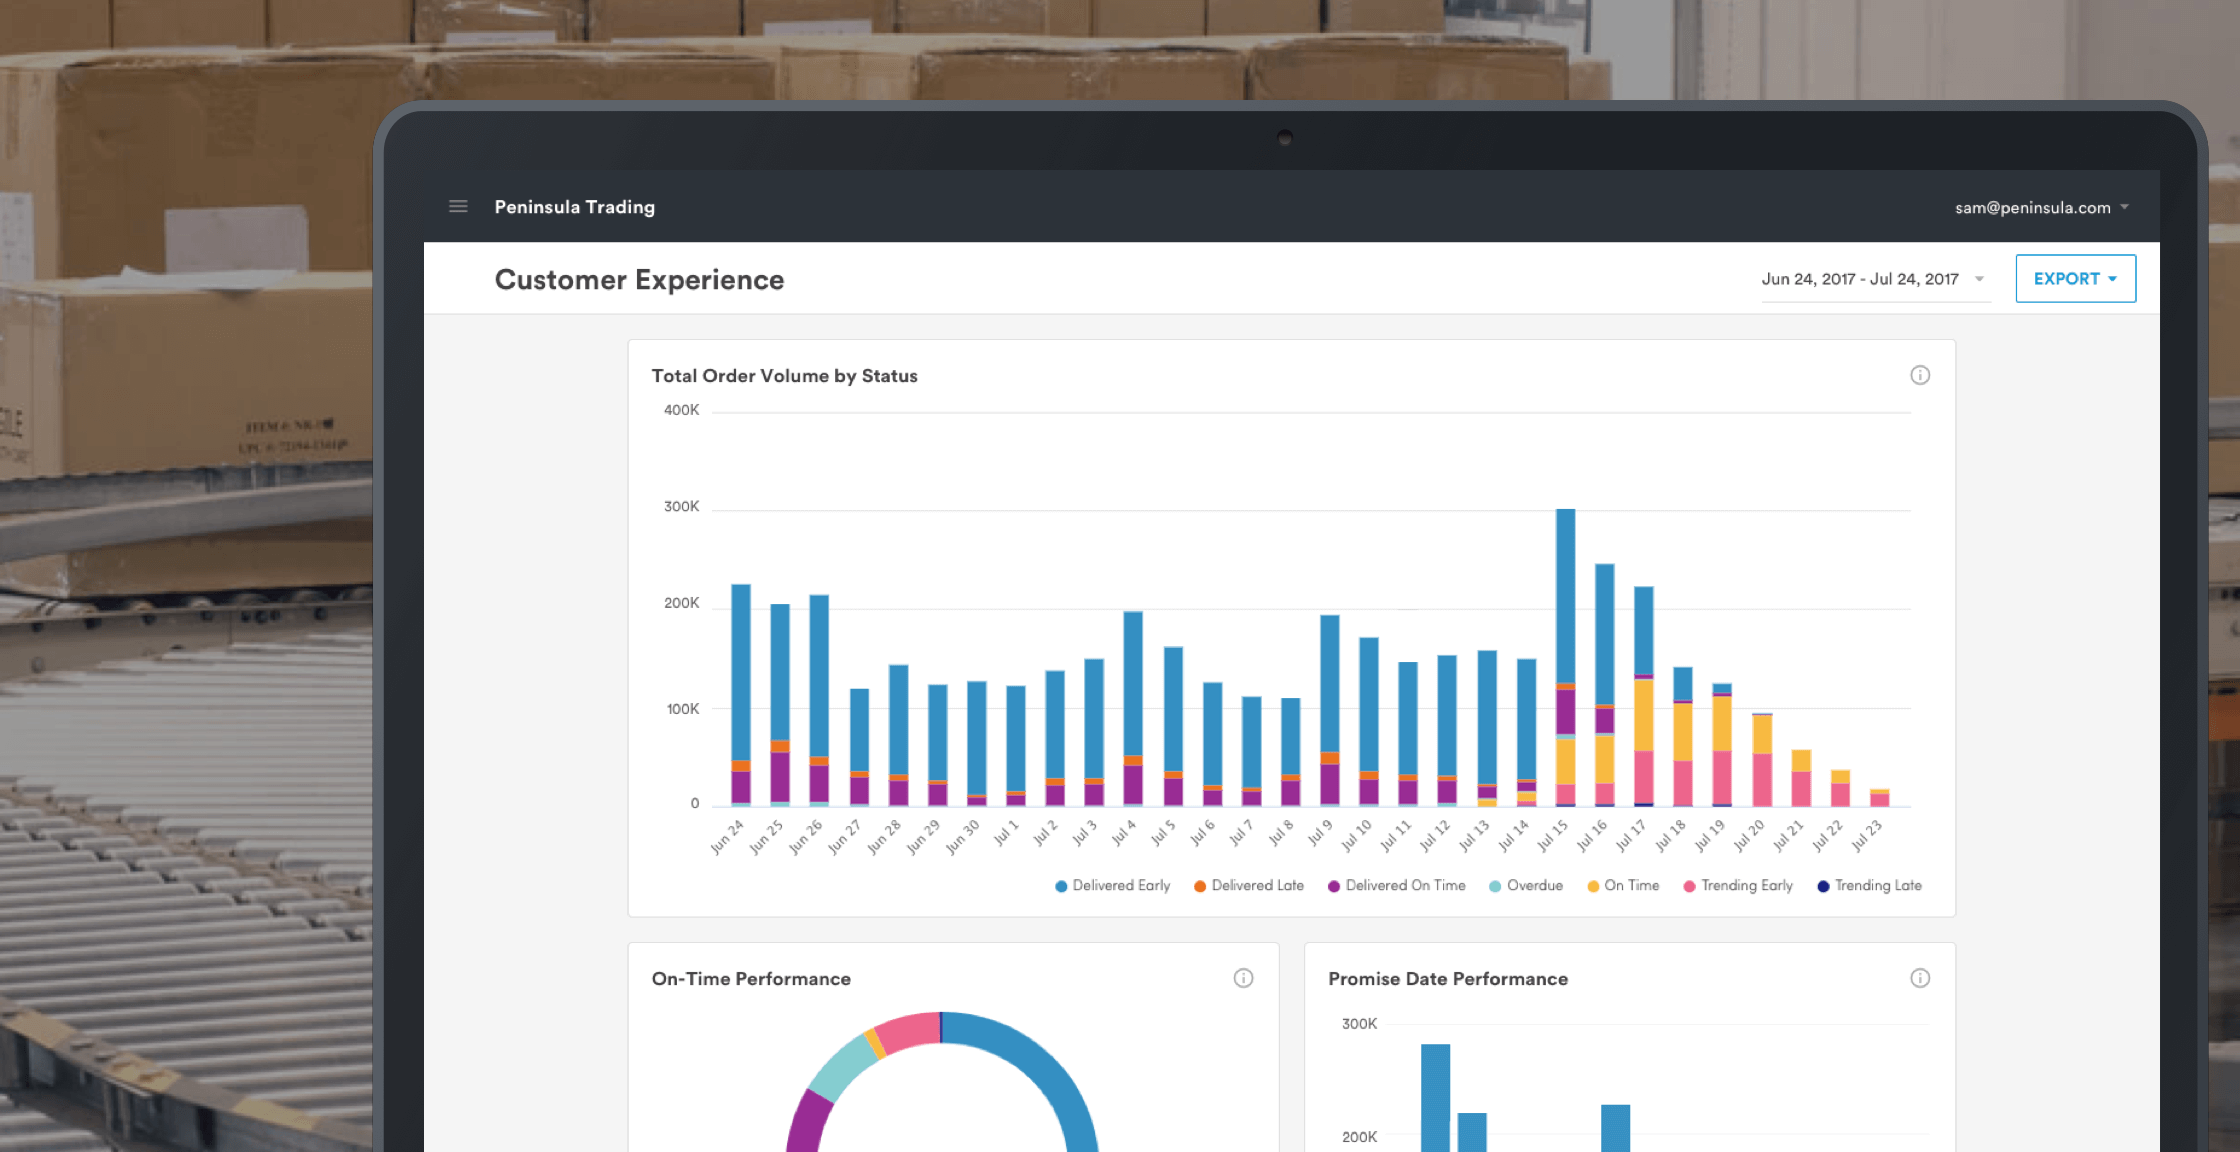
Monitor, Narvar analytics solution, helps retailers visualize over 3 billion interactions generated by their logistics network and their customer experience. It was therefore very important to help retailers make sense of all this data. So that they can turn these many insights into action. We defined a simple interface for users to have a high-level overview, investigate abnormal trends, and proactively solve issues.
To comply with my non-disclosure agreement, I have omitted and obfuscated confidential information in this case study. The information in this case study is my own and does not necessarily reflect the views of Narvar.
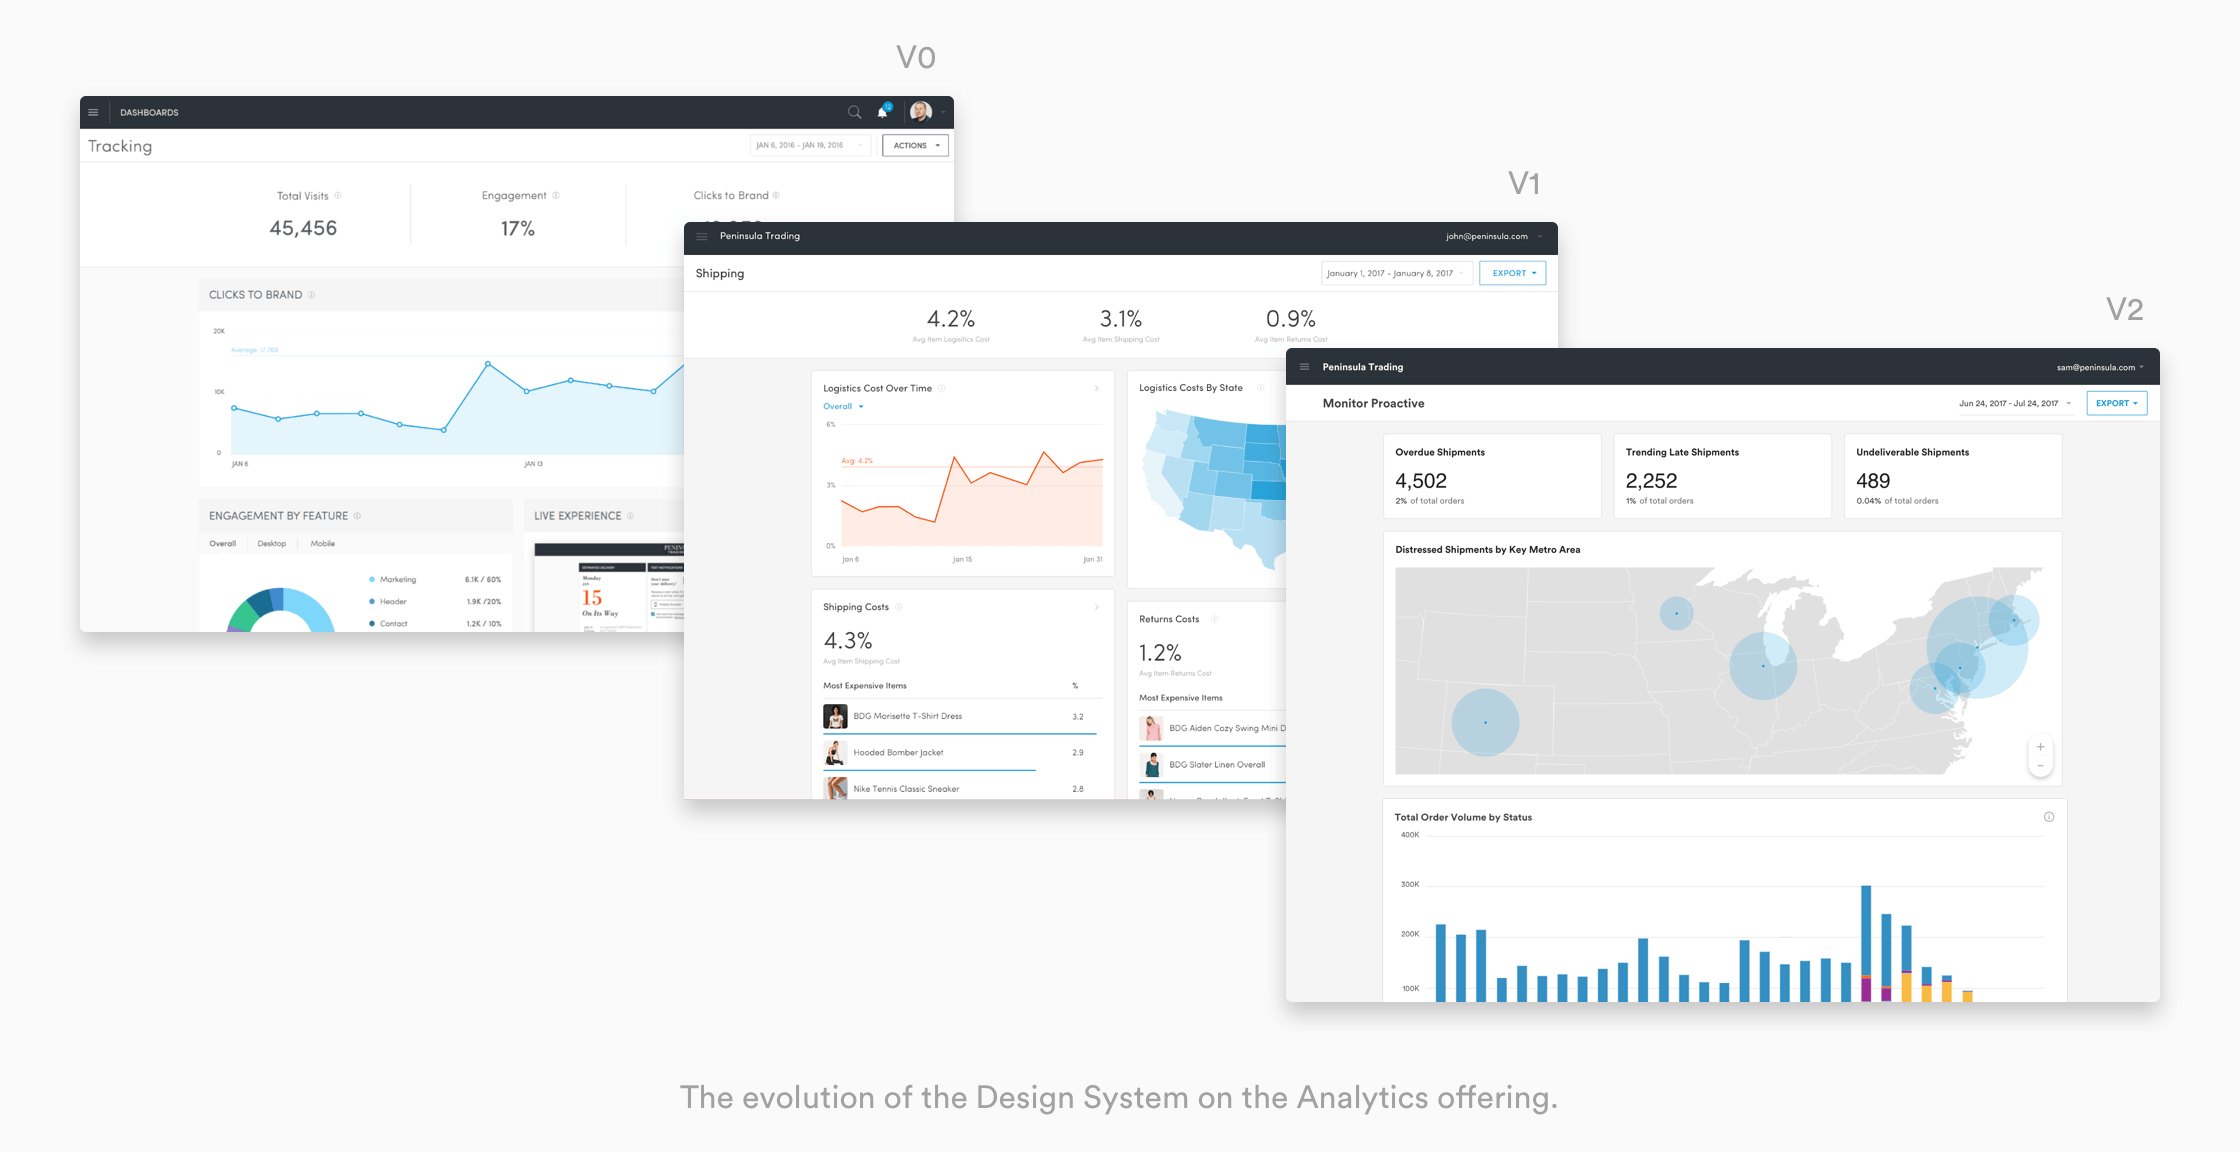
A Seamless User Flow
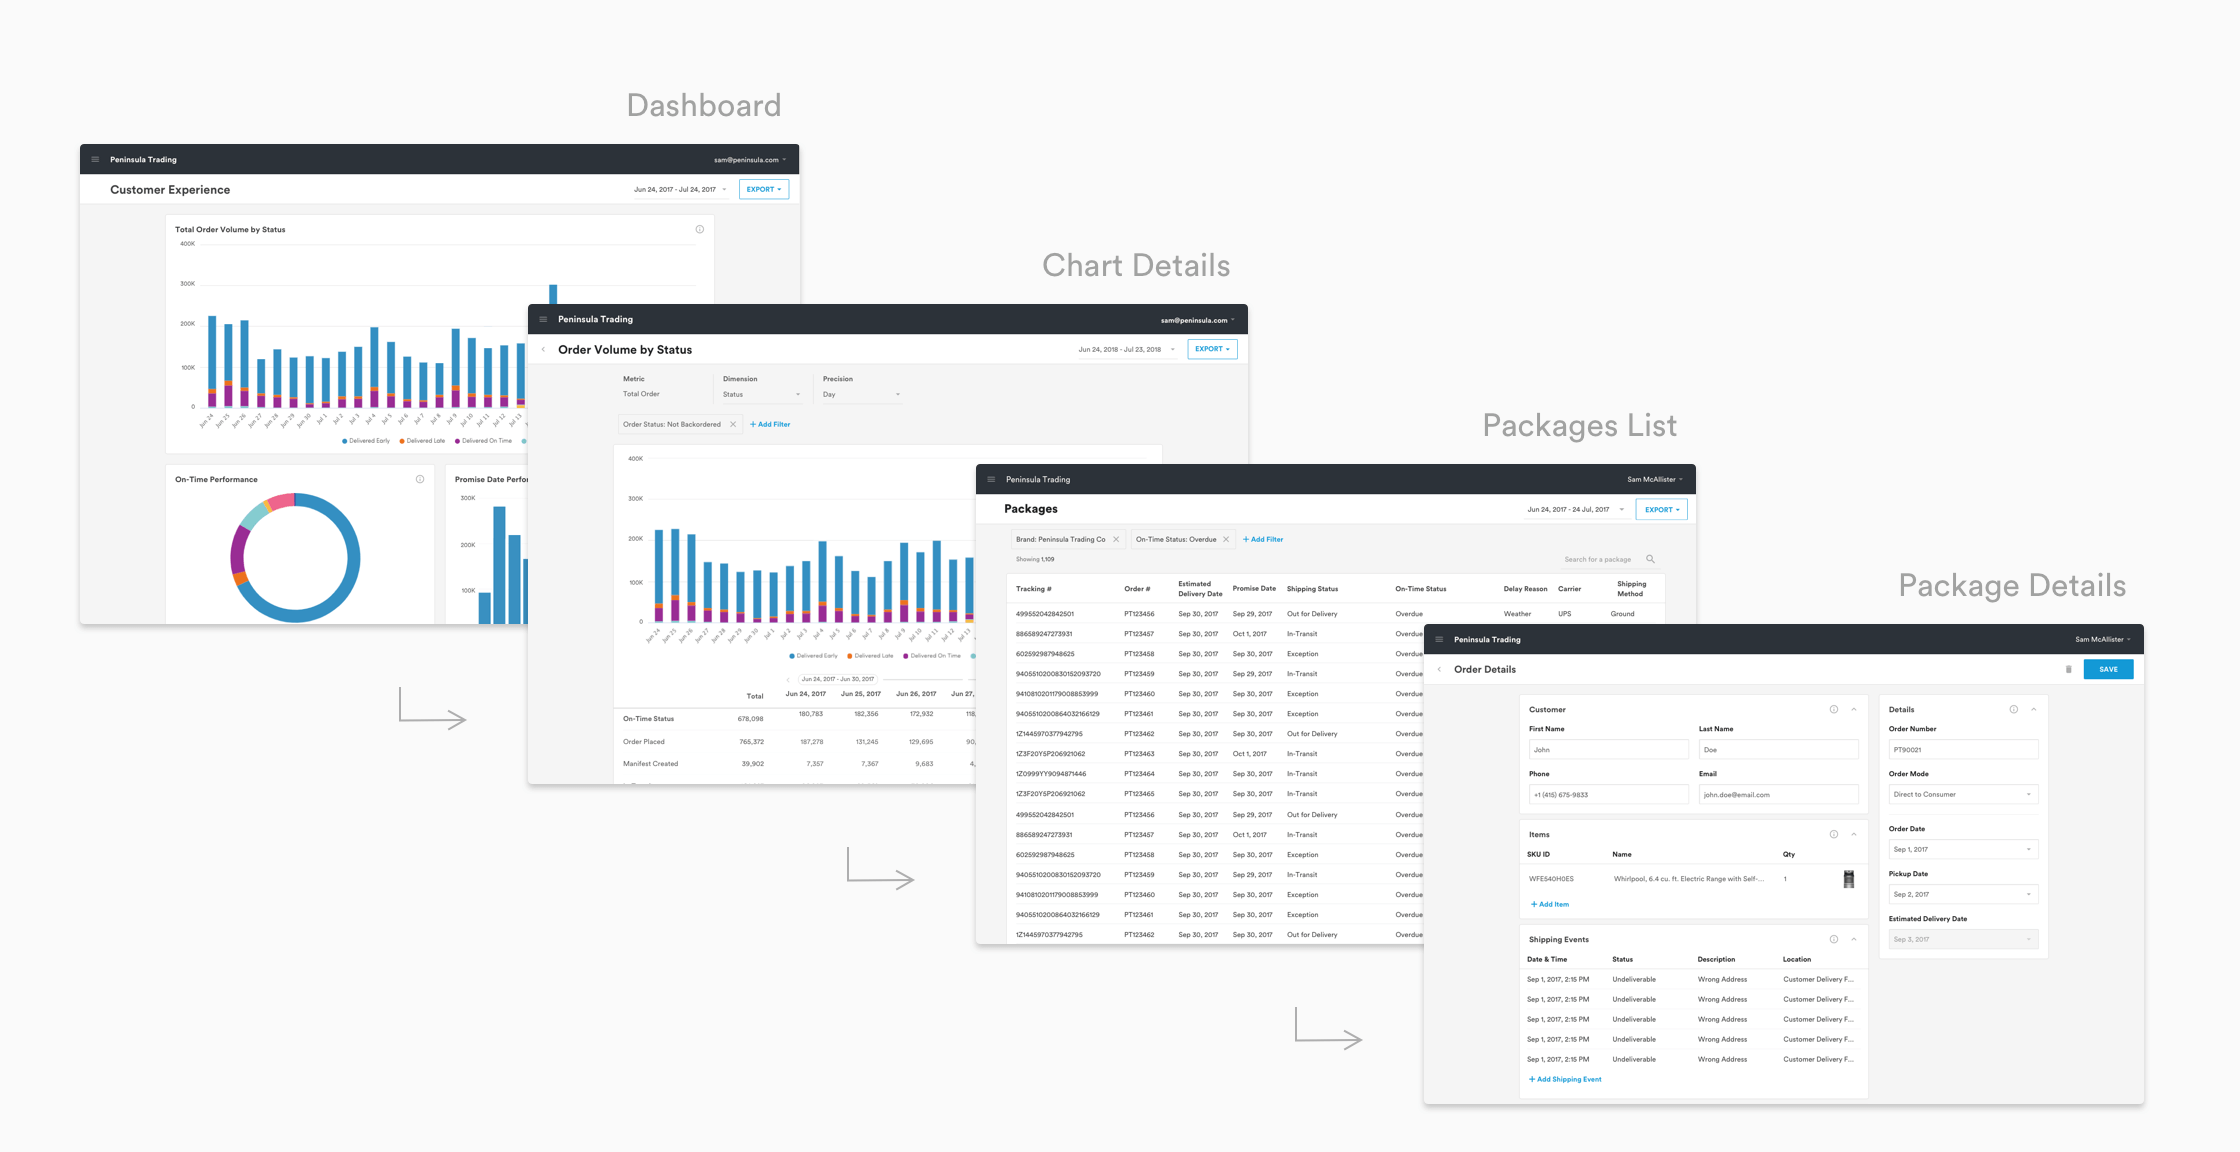
As part of Hub platform, I led the design efforts of this solution. Based on complex requirements from our early customers, such as GAP, I defined a simple user flow composed of 4 steps each offering more and more data, so that users could drill down to the level of granularity needed to better understand their network.
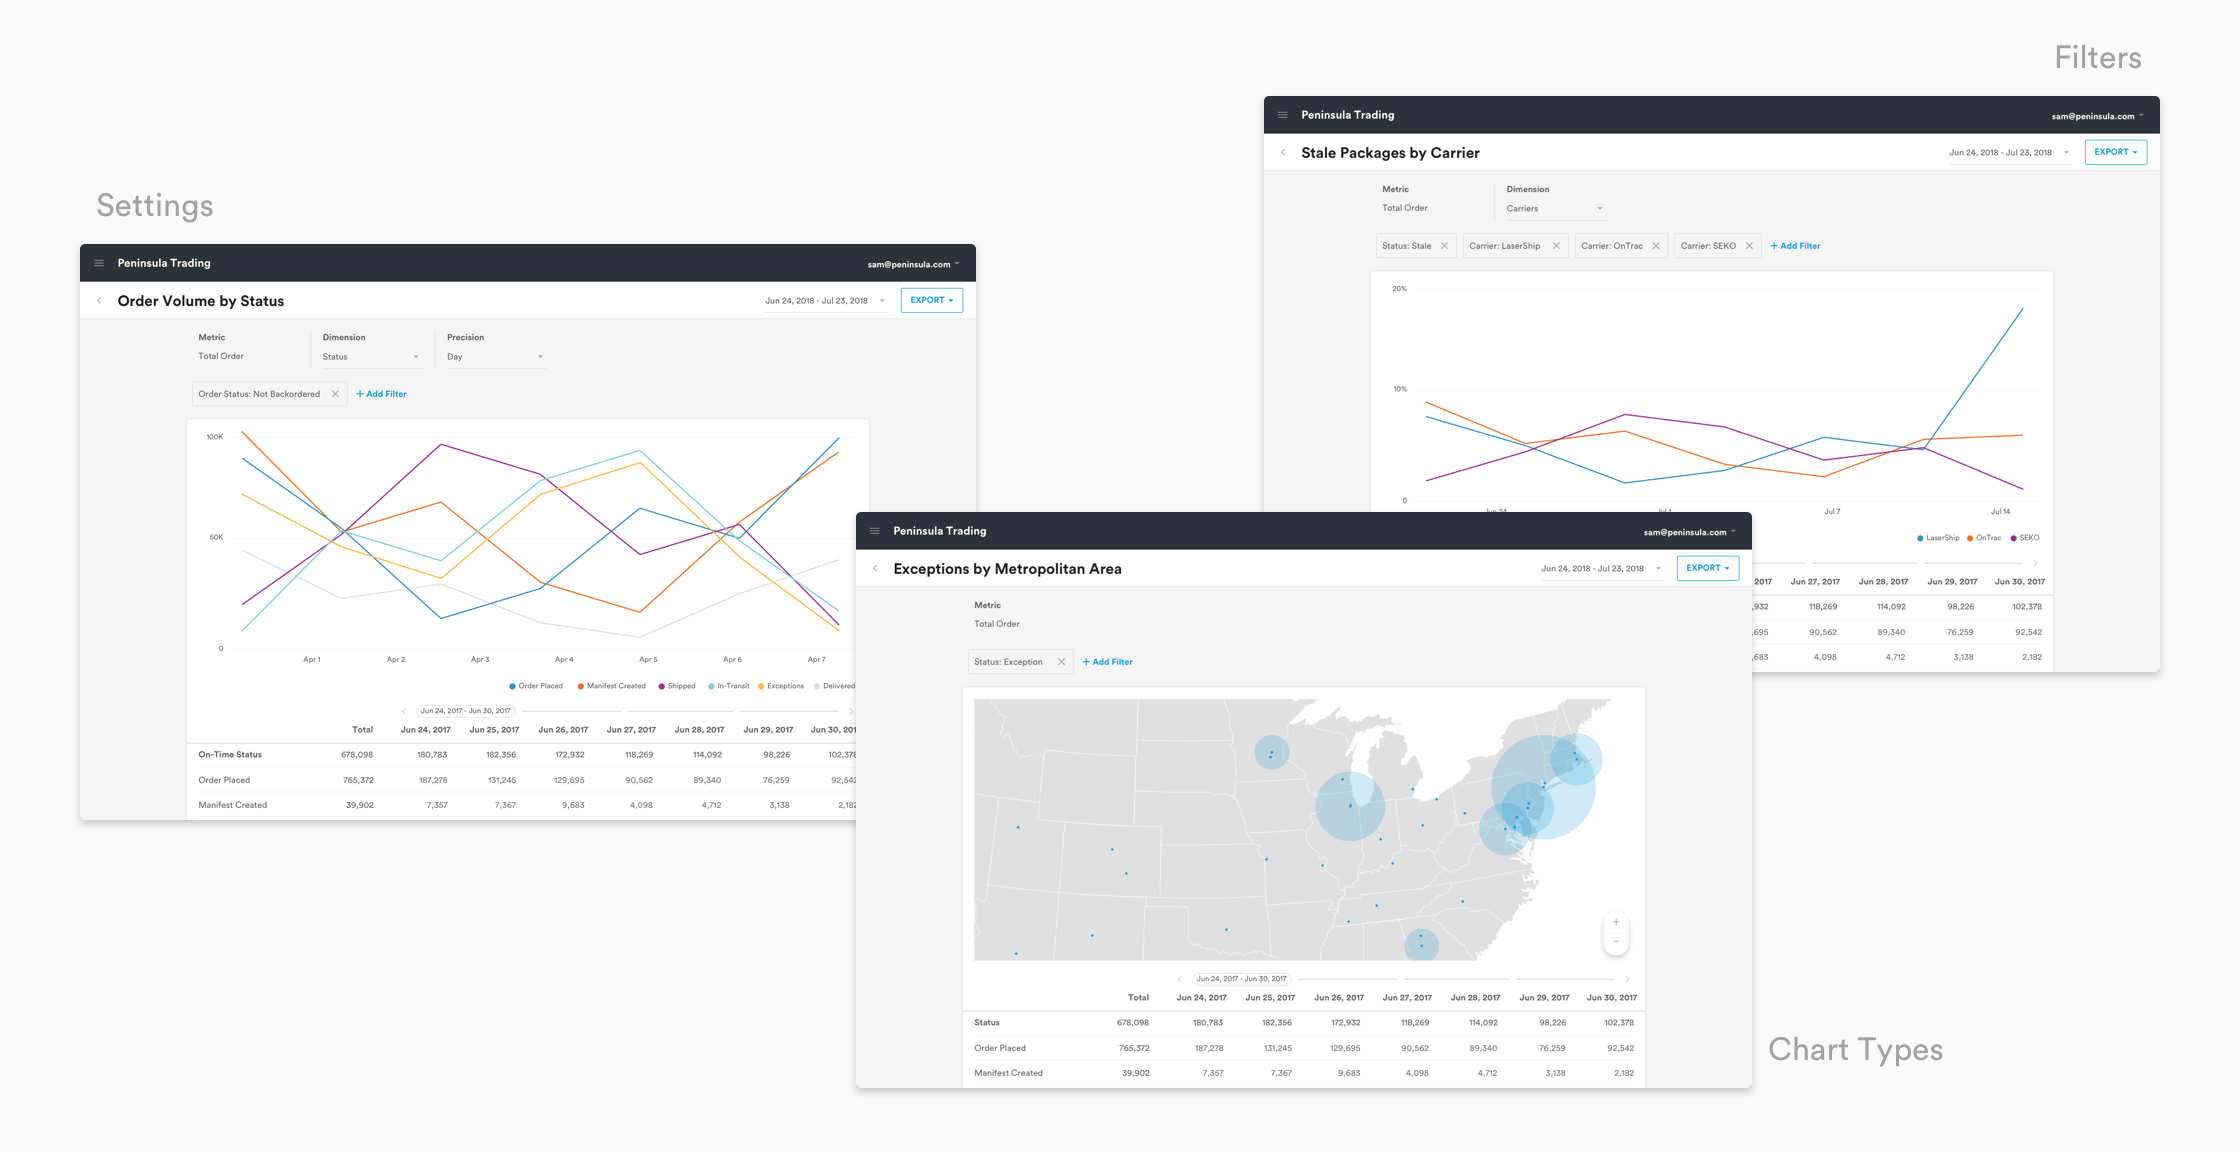
Explore Data to Extract Insights
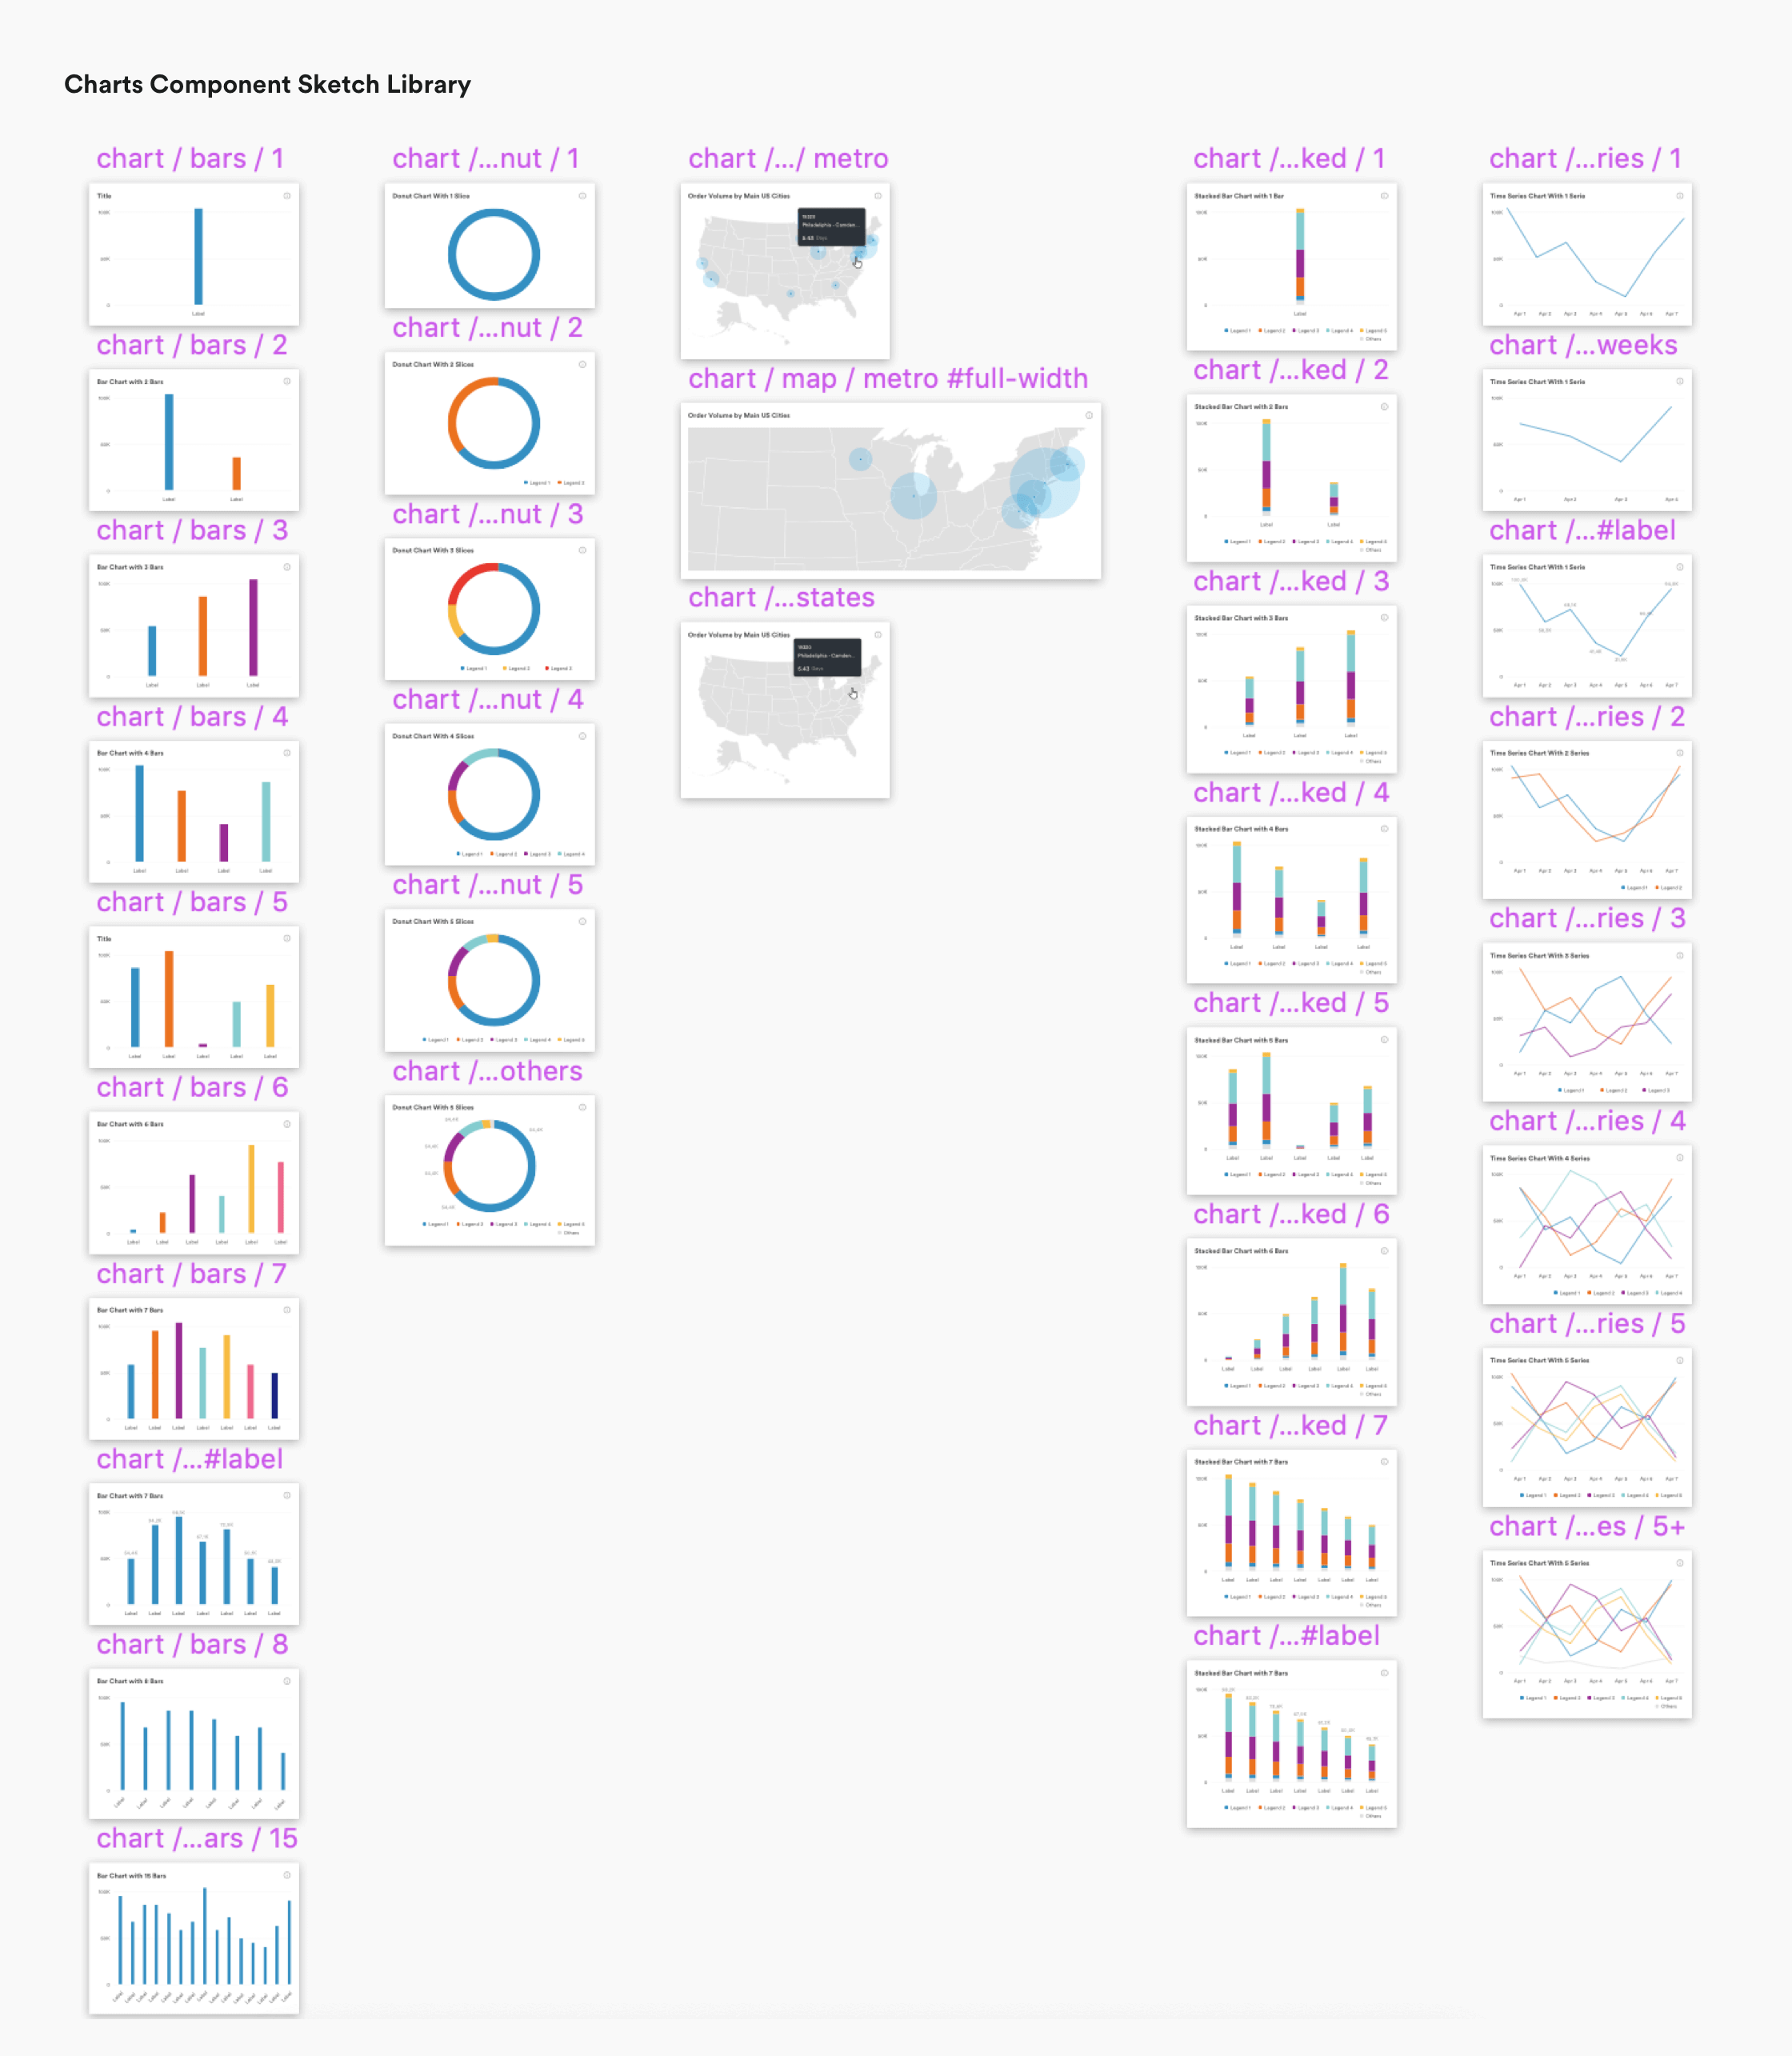
All the chart components are oriented around exploration. Charts are extensively customizable with types, filters, and time periods so that the user understands fully the big picture.
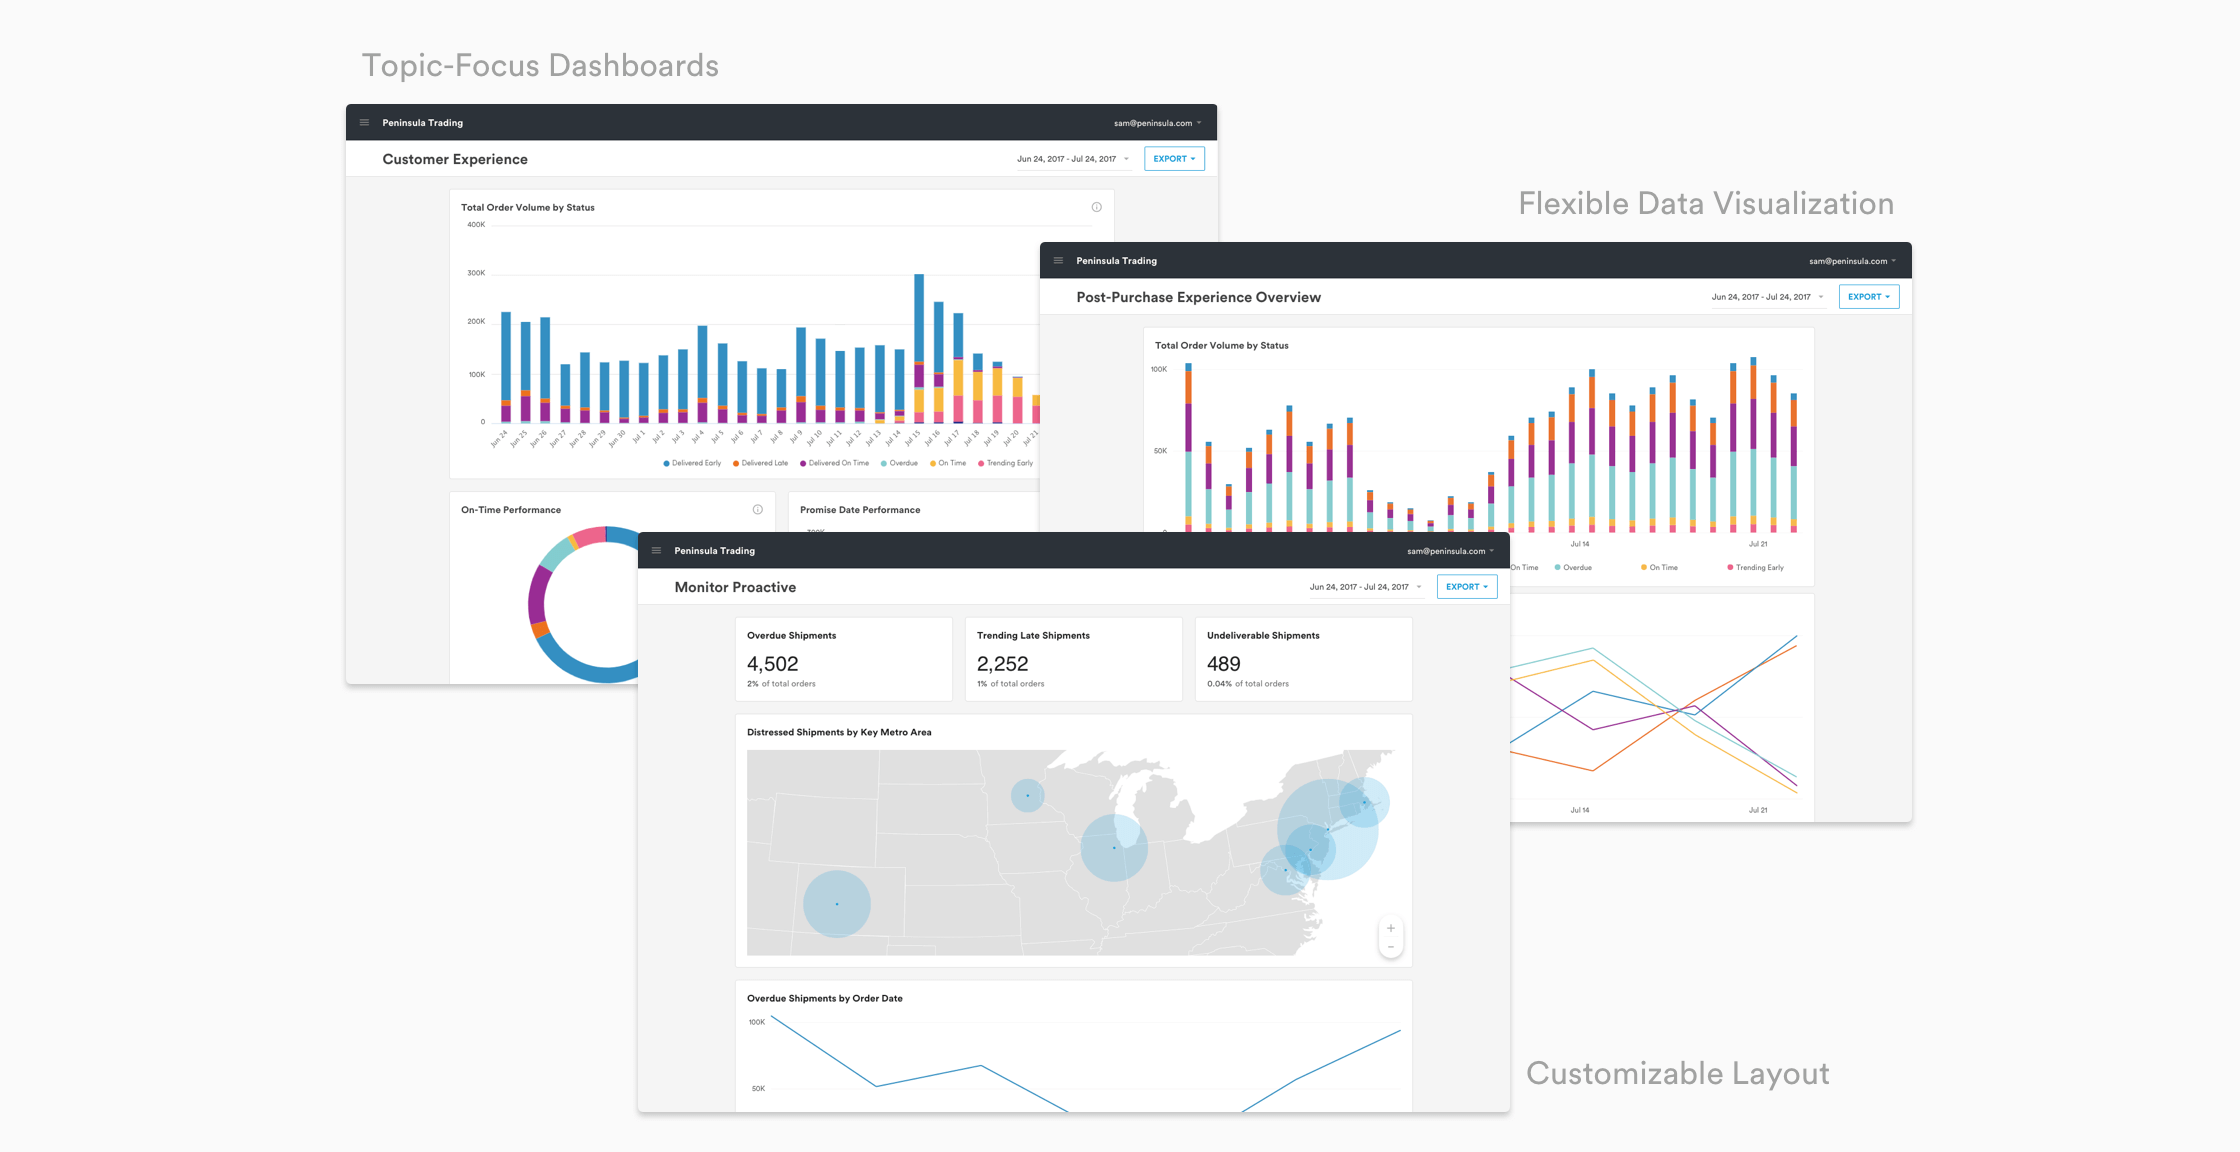
To Every Story Its Visualization
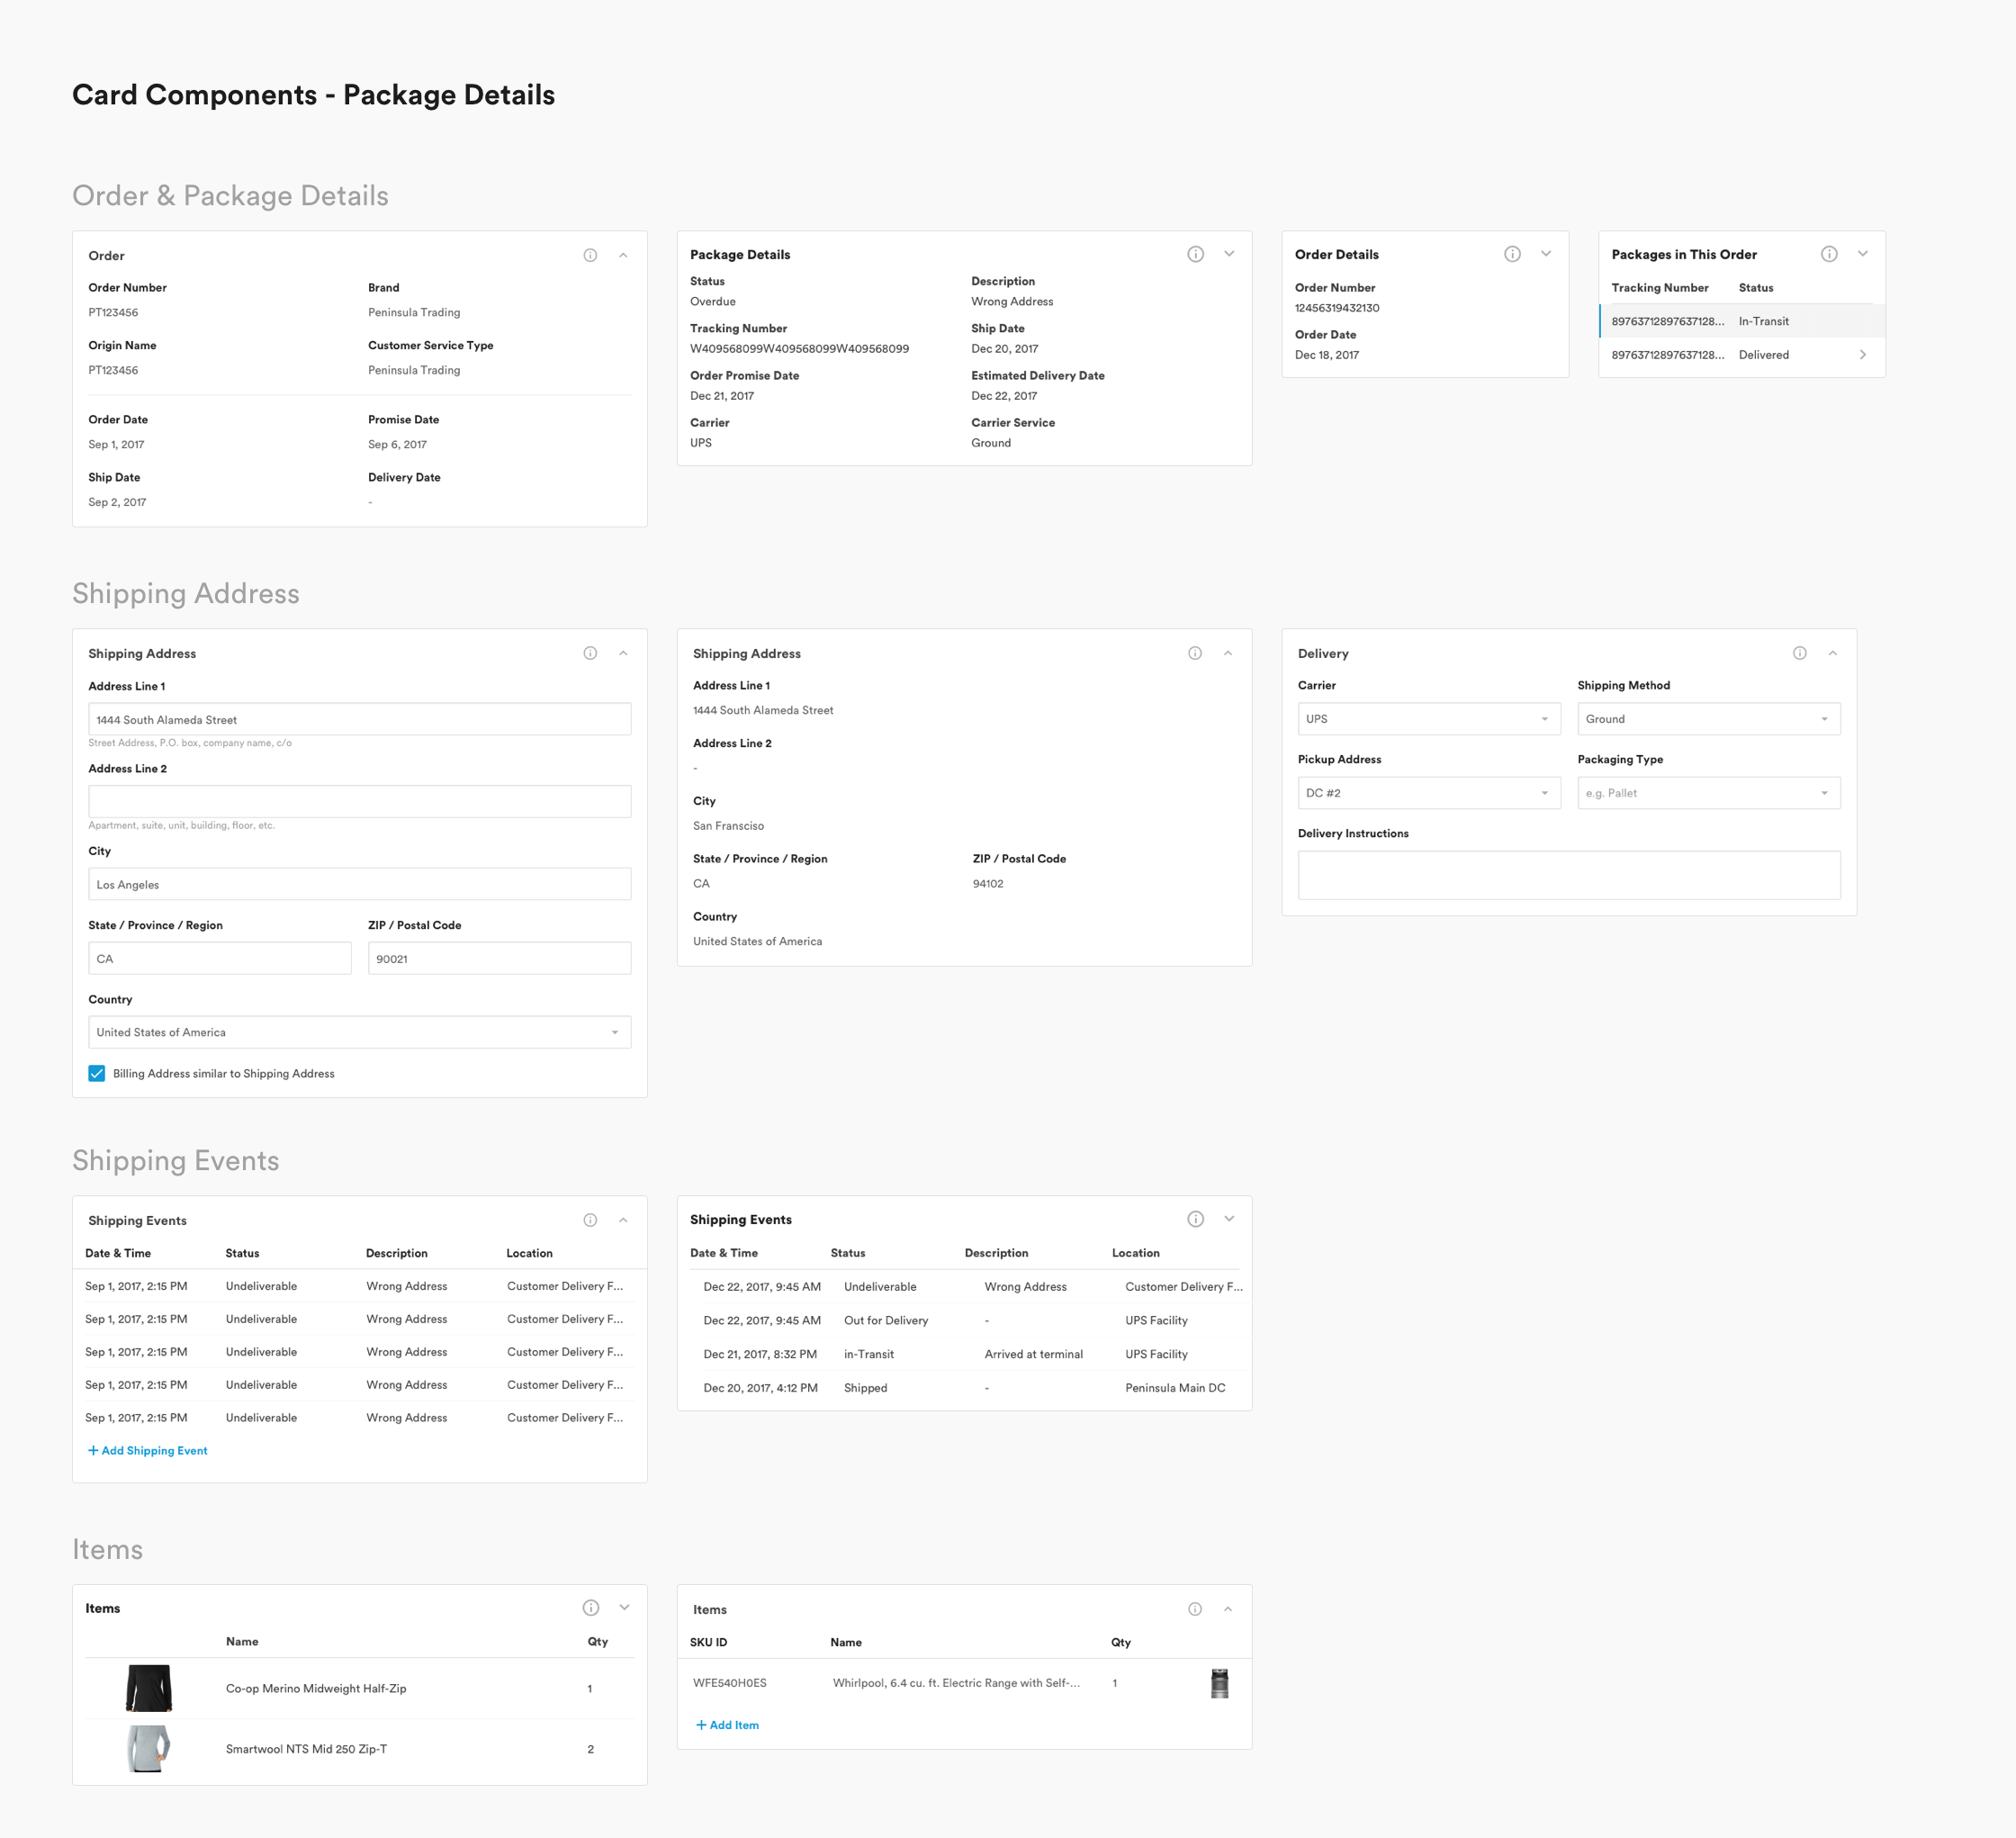
Every retailer and every user has its own needs in terms of data visualization. So I designed a solution for users to customize charts and dashboards very easily to display the information in a meaningful way.
My Work
Selected samples of my work, 100% handcrafted by me.